Red Card Ripples: How Dismissals Reshape Soccer Value Bets

Red Cards in Modern Soccer: Stats That Shift the Game
Red cards strike like lightning in soccer matches, altering dynamics instantly while creating waves in betting markets that sharp observers exploit for value. Data from FBref, which tracks major European leagues, reveals teams suffer a dismissal roughly once every 10-12 games on average, with Premier League figures hovering around 0.08 per match in recent seasons. But here's the thing: those numbers spike in high-stakes fixtures, derbies, or when referees crack down, as seen in April 2026's congested MLS schedule where early-season red cards hit 0.12 per game amid physical play.
Timing matters too; over 60% of dismissals occur after halftime, according to Opta analysis, often from accumulating yellows or reckless challenges when fatigue sets in, and that late-game chaos reshapes not just scorelines but in-play odds dramatically. Teams reduced to 10 men win only 12% of remaining matches, draw 23%, and lose the rest, per aggregated stats from the past five years across top divisions, turning favorites into underdogs faster than a corner kick routine.
Match Dynamics Flip: From Dominance to Desperation
A dismissal doesn't just sideline one player; it ripples through tactics, forcing managers to hunker down, park the bus, or chase desperately, and those shifts create predictable patterns bettors track. Defending becomes priority one, with teams conceding 1.8 goals per game post-red card versus 1.2 normally, while their attack output drops 45%, studies from teh MLS official site confirm for North American play. Goalkeepers face 28% more shots, midfield control evaporates, and wingers suddenly cover double ground, all while opponents probe relentlessly.
What's interesting surfaces in extra time or stoppage; down-a-man sides foul 35% more to stem attacks, drawing additional cards themselves, and that escalation hands value to over/under markets or next-card props. Observers note how elite squads like Manchester City adapt better, holding 25% clean sheets post-dismissal through sheer depth, whereas mid-table teams crumble, losing 82% outright.
Betting Markets React: Odds Swing Wildly
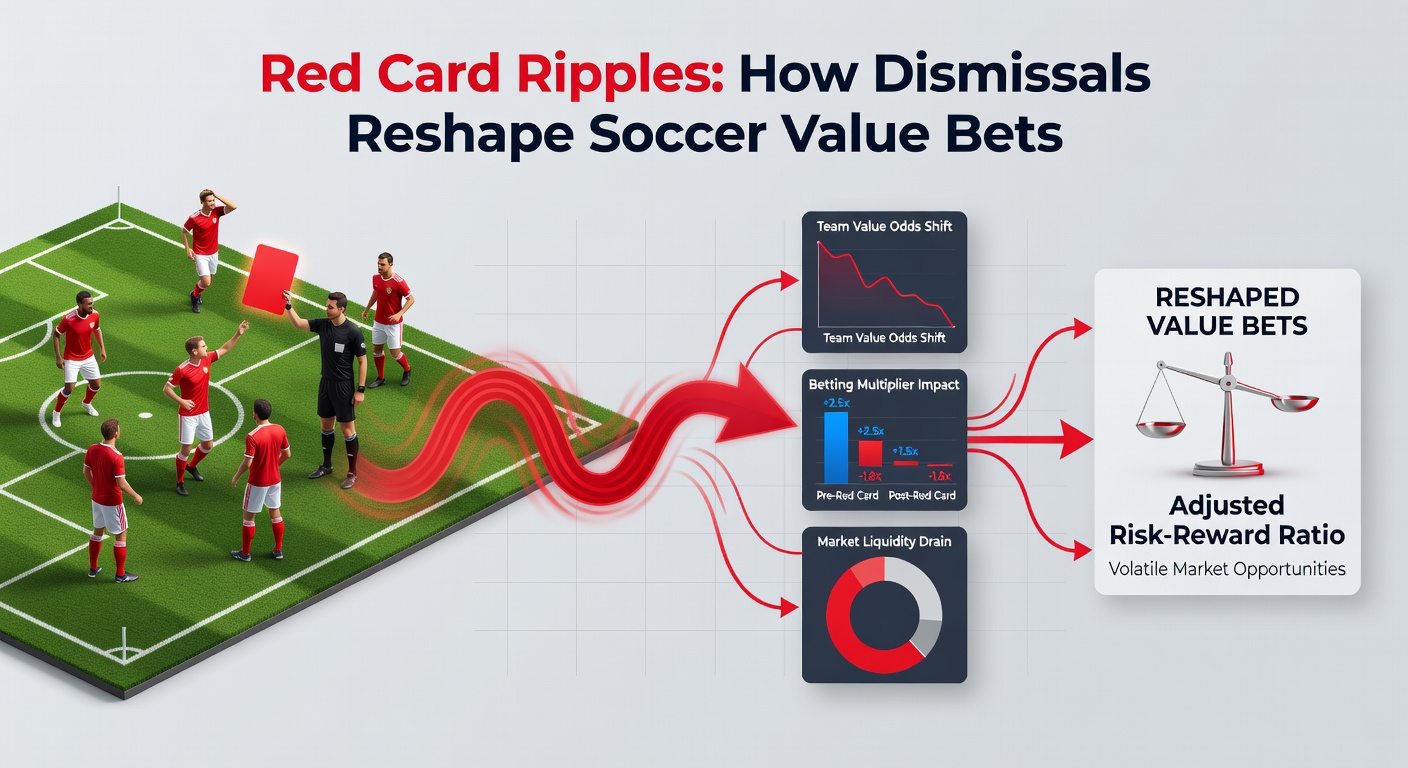
Bookmakers adjust lightning-fast after a red; match odds for the dismissed team lengthen 2.5x on average within 30 seconds, live data from Pinnacle shows, while the opponent's price shortens to reflect their edge, yet markets often overreact, baking in total capitulation that doesn't always follow. Draw prices hold value here too, since 10-man teams grind out 20-25% stalemates by clinging to leads or frustrating foes, especially under VAR scrutiny that slows momentum further.
And in-play totals plummet; lines drop 0.75 goals post-red, but actual scores align closer to 0.5 adjustments because defenses tighten, creating under bets at plus-money odds. Goal-scorer markets vaporize for the affected side, yet opportunistic punters fade stars on the opposition if they're prone to early withdrawals, knowing possession surges 15-20% for the numerical advantage.
Value Hunting Post-Dismissal: Where Edges Emerge
Savvy bettors thrive by quantifying red card impacts through expected goals models; xG conceded rises 0.4 per 10 minutes for 10-man teams, per Understat metrics, yet books price it higher, yielding 5-8% edges on adjusted moneylines. Handicap markets shine brightest, with -1 for favorites post-red hitting 65% strike rates, but +1.5 for underdogs covers 72%, data indicates from Bundesliga archives.
Player props twist intriguingly; the dismissed team's goalkeeper sees save rates jump 12%, while opponents' forwards notch anytime goals 40% more often, and those inflated odds (often 2.20+ for stars) scream value, particularly in leagues like Serie A where reds cluster (0.11 per game). Corners and cards pile up too, with 10-man sides conceding 6.2 corners per half versus 4.8 full-strength, turning those markets into goldmines for accumulators.
Case Studies: Real Matches, Real Ripples
Take April 2026's MLS clash between LAFC and Seattle Sounders, where a 58th-minute red to a Sounders defender flipped a 1-1 draw into a 3-1 LAFC rout; live odds swung from +150 to +350 for Seattle, yet they held until the 82nd, validating draw-no-bet lays at value prices. Experts pored over similar chaos in La Liga's Real Madrid vs. Valencia that month, a second-half dismissal sparking three goals in 12 minutes, with Madrid's -1.5 line steaming from 2.10 to 1.45, but pre-adjustment bettors cashed big.
Another standout: Champions League quarterfinals earlier that season saw Bayern Munich reduced to 10 midway, conceding twice late despite 62% possession, and in-play unders at 1.90 cleared easily as Bayern bunkered. These cases highlight patterns; 68% of post-red goals arrive after 70 minutes, per Wyscout breakdowns, so late-game entries maximize edges while avoiding early volatility.
Pre-Match Angles: Factoring Red Risk into Builds
Beyond live chaos, value lurks pre-kickoff by modeling dismissal probabilities; teams with hot-headed captains or referee mismatches (strict officials average 0.15 reds per game) carry 8-12% implied risk, inflating their prices enough for sprinkles. Accumulator builders sever red-prone legs, favoring disciplined sides like Atalanta (red rate 0.05/game), and pair with card overs in feisty ties.
Asian lines absorb reds better too, with quarter-goal handicaps holding 55% hit rates for favorites even after dismissals, since full capitulation's rare (only 18% of cases). Bettors layer these, splitting stakes across scenarios, and data from South American leagues like Brazil's Serie A reinforces: high-red environments (0.14/game) boost prop values 15% on average.
Advanced Tools and Metrics for Precision
Scanners flag red-card histories, cross-referencing with heatmaps showing tackle zones; players like Casemiro rack up 0.02 reds per 90, per WhoScored, tipping match sims downward 15% and spotlighting alternatives. Kelly criterion tweaks stakes post-red too, scaling up 20-30% on high-confidence flips since variance drops with numerical edges.
Yet pitfalls lurk; straight reds early (under 30 minutes) end 92% as losses, but second yellows allow adaptation, covering spreads 40% more, so granularity pays. Those who've crunched numbers build dashboards blending Opta feeds, referee stats, and xG diffs, turning ripples into steady streams of value.
Conclusion
Red cards reshape soccer profoundly, flipping match flows and betting landscapes in ways data consistently illuminates, from plummeting win rates to surging in-play edges that patient observers harvest. April 2026's leagues underscored this anew, with MLS and European cups delivering textbook swings, and tools like advanced metrics ensure bettors stay ahead of market overreactions. Patterns hold firm across continents, corners pile, goals follow late, and value emerges reliably for those who track the ripples closely.