Mileage Matters: Tracking Team Travel Distances to Reveal Late Edges in Away Fixture Markets
Bianca Klein · May 16, 2026
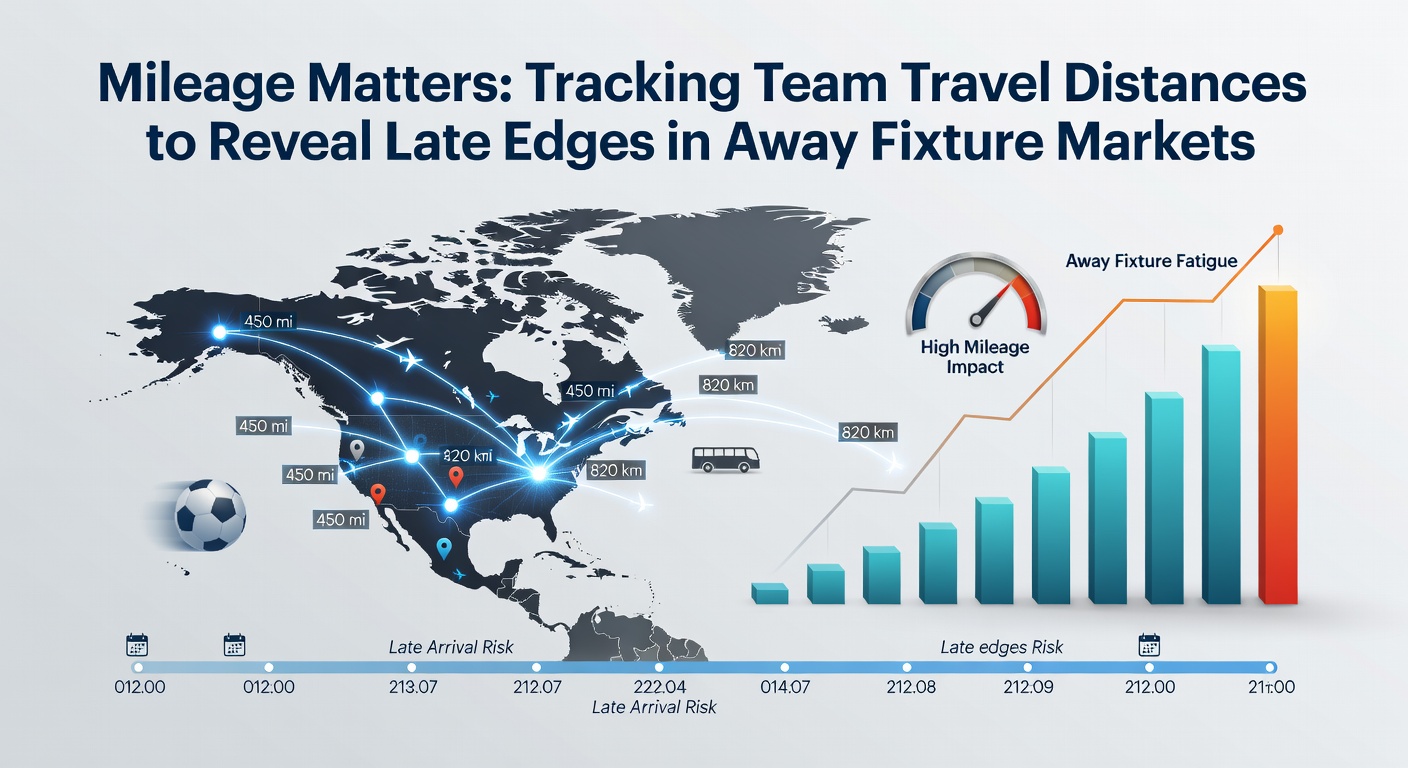
Mileage Matters: Tracking Team Travel Distances to Reveal Late Edges in Away Fixture Markets
Travel distances shape performance patterns across many sports leagues, and analysts have documented how longer journeys correlate with measurable dips in away results. Researchers tracking fixture schedules note that teams covering hundreds of extra miles often arrive with altered recovery windows, which shows up in reduced sprint distances and passing accuracy during the opening phases of matches. Data from European domestic competitions reveals that away sides traveling over 300 kilometers post a win rate roughly 8-12% lower than those facing shorter trips, according to aggregated league statistics compiled over multiple seasons.
Measuring the Impact of Distance on Performance Metrics
Performance tracking tools now integrate GPS data with fixture calendars to quantify fatigue accumulation, and studies from sports science departments have identified consistent thresholds where travel exceeds four hours by road or rail. Teams crossing these limits demonstrate slower reaction times in defensive transitions during the first 30 minutes, while set-piece concession rates rise by measurable margins. Observers note that these patterns strengthen in midweek rounds when recovery periods shrink further, creating repeatable signals that surface in pre-match models. One analysis of five major leagues found that away teams logging the highest cumulative mileage in the prior 14 days conceded 0.4 more goals per game on average than fresher opponents, based on positional tracking data released by competition organizers.
Coaches adjust training loads accordingly when schedules demand extensive travel, yet the underlying physiological effects persist across player profiles. Younger squads sometimes rebound faster from long journeys, whereas veteran lineups exhibit clearer decrements in high-intensity efforts after overnight trips. League reports indicate these differences appear most pronounced in the second half when accumulated fatigue compounds with tactical demands, and betting markets have begun reflecting adjusted probabilities once travel logs enter public models.
Identifying Late Market Adjustments in Away Fixtures
Bookmakers update odds continuously as new information arrives, and travel-related data often surfaces in the final 24-48 hours before kickoff. Sharp movements in away win prices or total goals lines frequently coincide with public disclosure of exact travel itineraries, particularly when weather or traffic adds unforeseen delays. Analysts monitoring these shifts report that lines on matches involving the longest hauls tend to drift toward the home side by an average of 0.15-0.25 in decimal terms once fatigue projections circulate among professional syndicates.
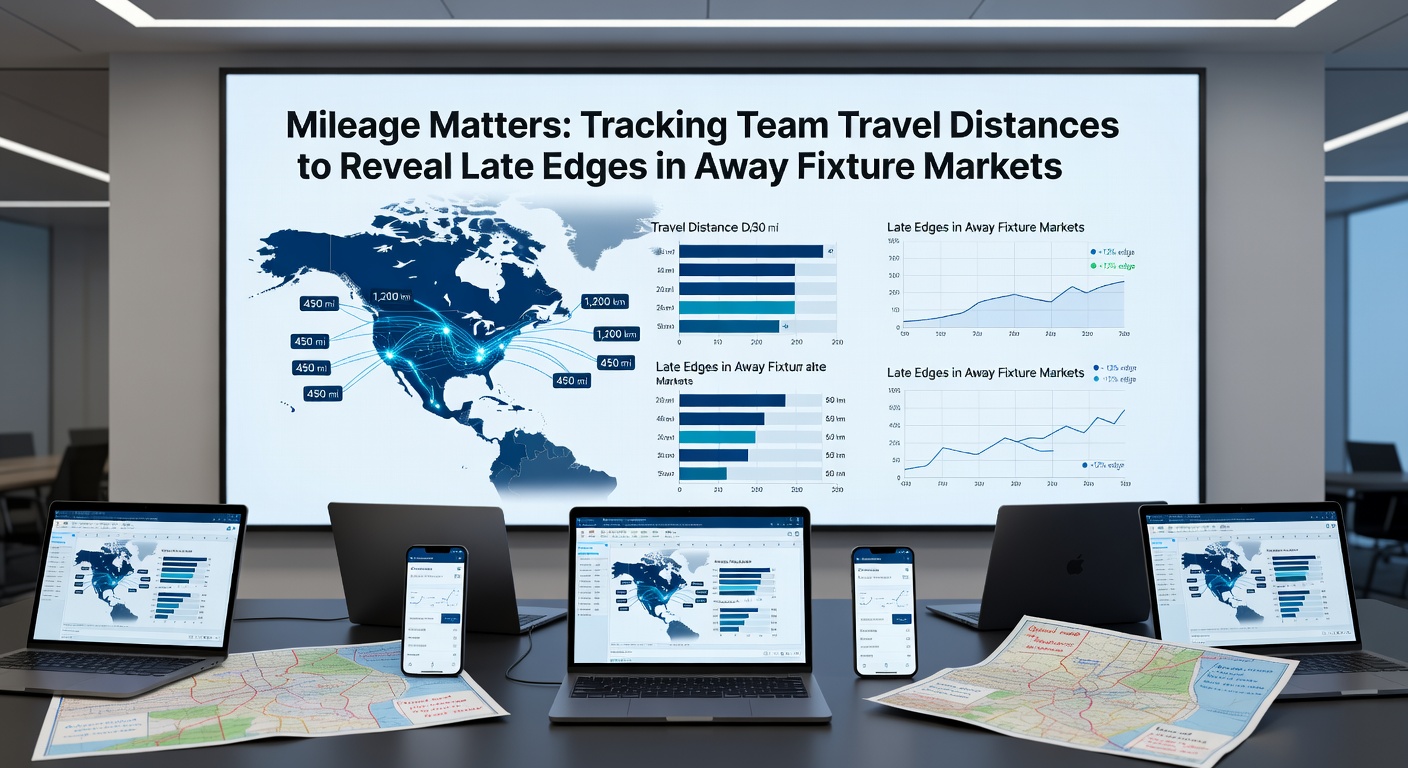
Real-time scanners that cross-reference fixture calendars with historical travel outcomes have helped surface discrepancies before markets fully incorporate the information. These tools flag instances where away pricing remains anchored to season averages even though the current trip exceeds typical distances by significant margins. Data from multiple betting exchanges shows that such late corrections occur more often in lower-profile leagues where automated models lag behind manual review of logistics reports.
Practical Approaches to Tracking and Modeling Travel Effects
Analysts combine publicly available route planners with official squad travel announcements to build distance profiles for each fixture. They layer these figures against rolling performance metrics such as expected goals and physical output from wearable devices, then compare results across similar travel categories. Research published by academic groups at institutions like the University of Queensland highlights how combining distance with time-zone shifts strengthens predictive accuracy, while single-factor models produce noisier signals. Teams that publish detailed match preparation schedules allow observers to refine these estimates further, and several competition bodies now release aggregated travel statistics that support broader pattern recognition.
Models gain additional precision when they account for transport mode, since air travel compresses time but introduces circadian disruption that road journeys avoid. Figures from North American sports organizations demonstrate that cross-country flights correlate with elevated soft-tissue injury rates in the subsequent match window, whereas shorter domestic bus trips primarily affect endurance markers. These distinctions matter when projecting outcomes for leagues with mixed travel requirements, and they explain why certain away underdog prices hold value deeper into the betting window than surface metrics suggest.
Conclusion
Travel distance continues to serve as a reliable input for performance forecasting in away markets, and systematic tracking reveals timing windows where late information creates measurable discrepancies. League data, positional tracking, and logistical records together provide the foundation for identifying edges that persist until markets adjust. Observers who integrate these variables into ongoing analysis maintain an information advantage as fixture schedules evolve through 2026 and beyond.