Charting Integration Points Across Betting Analysis Platforms
Leon Keller · Jun 25, 2026
Charting Integration Points Across Betting Analysis Platforms
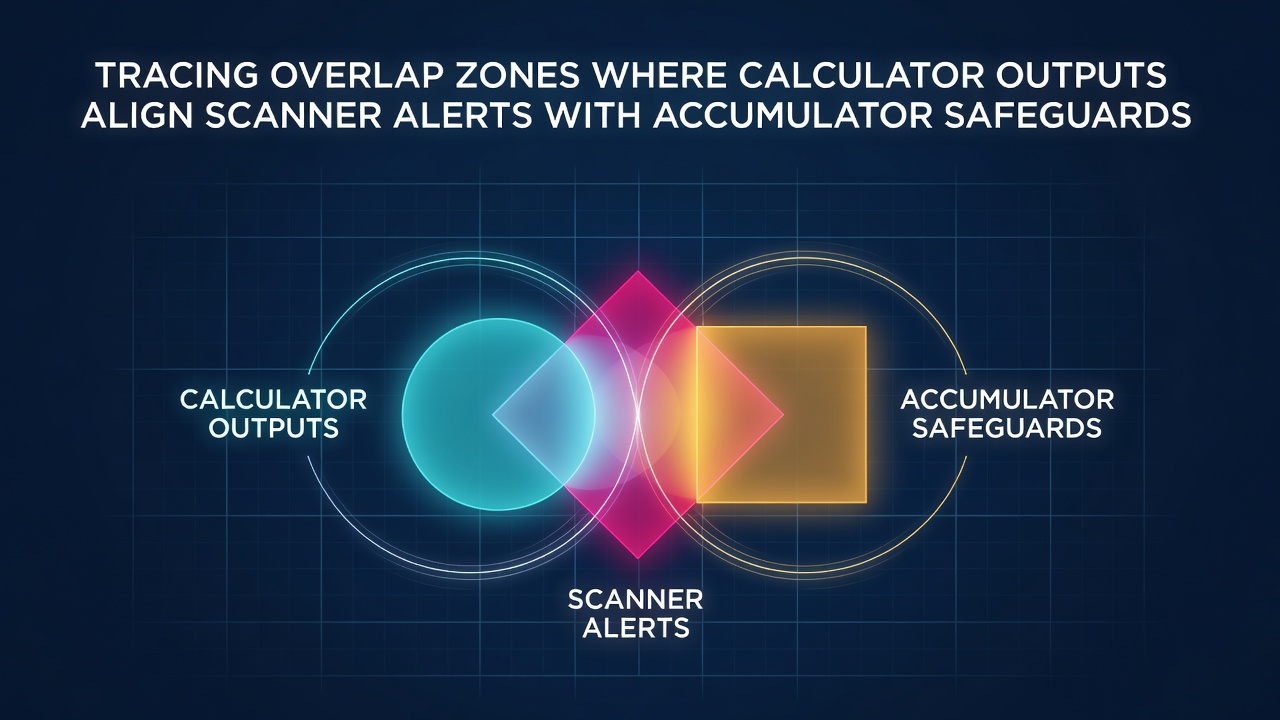
Betting analysis platforms combine multiple software layers that process odds data, stake recommendations, and multi-leg protections. Calculators generate output values based on probability inputs and market prices, while scanners monitor live feeds for discrepancies and accumulator safeguards enforce limits on correlated selections or exposure caps. Overlap zones emerge when these systems produce matching signals within defined parameters, allowing operators to identify consistent edges without manual cross-checking.
Core Components in Platform Architecture
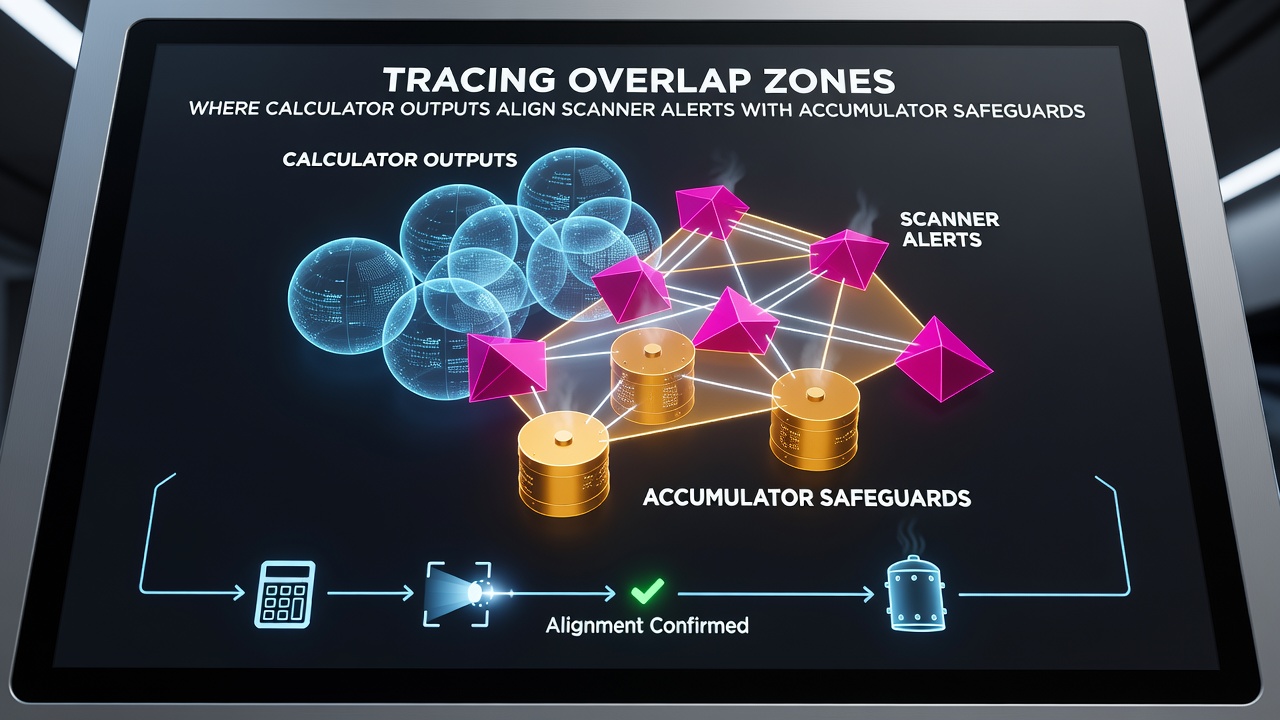
Calculators handle stake sizing through formulas that incorporate implied probabilities and bankroll percentages. Scanners pull real-time data streams from multiple bookmakers, flagging instances where odds deviate from modeled expectations. Accumulator safeguards operate as rule-based filters that reject combinations exceeding preset correlation thresholds or variance limits. When calculator outputs match scanner alerts inside these safeguard boundaries, the resulting alignment creates zones where automated decisions can proceed with reduced manual oversight.
Research from the University of Nevada's International Gaming Institute indicates that such alignments occur most frequently in markets with high liquidity and standardized data feeds. Data compiled through mid-2026 shows alignment rates climbing during periods of elevated trading volume, particularly in European football and North American basketball fixtures.
Mapping Overlap Frequency and Timing
Overlap detection relies on timestamp synchronization across modules. A calculator might output a recommended stake at 14:32 UTC, while a scanner registers an alert at 14:33 UTC for the same selection set. Safeguards then validate the combination against historical correlation matrices before approval. Platforms record these events in audit logs, revealing patterns tied to fixture schedules and market closures.
One documented case from June 2026 involved a mid-week European league round where scanner alerts aligned with calculator outputs for three separate accumulator structures within a 12-minute window. The safeguards cleared two of the structures after correlation checks remained below 0.35, while blocking the third due to an overlapping player performance metric. Such instances demonstrate how temporal clustering affects the practical utility of integrated systems.
Technical Parameters Defining Alignment Zones
Alignment requires three simultaneous conditions: numerical agreement within a configurable tolerance band, temporal proximity under 90 seconds, and safeguard clearance on all legs. Tolerance bands typically range from 0.5% to 2% on implied probability differences, depending on sport and market depth. Systems using tighter bands report fewer but higher-confidence alignments, whereas wider bands increase alert volume at the cost of precision.
Industry reports from the Australian Gambling Research Centre note that platforms adjusting tolerance dynamically based on market volatility achieve higher alignment stability across sessions. The adjustments draw on rolling averages of odds movement rather than fixed thresholds, allowing safeguards to adapt without manual recalibration.
Regional Variations in Implementation
European operators tend to emphasize safeguard strictness on accumulator length, limiting alignments to selections under four legs in many cases. North American platforms focus more on live in-play adjustments, where scanner alerts trigger calculator recalculations mid-match. Canadian provincial regulators have documented similar patterns in sports betting data submitted by licensed operators, highlighting how local rules shape the frequency of overlap events.
Software vendors release periodic updates that refine alignment logic. June 2026 patches from several providers introduced enhanced timestamp granularity down to the millisecond, reducing false non-alignments caused by network latency. These updates also expanded correlation databases to include additional variables such as weather impacts on totals markets.
Conclusion
Overlap zones form at the intersection of calculator outputs, scanner alerts, and accumulator safeguards when technical conditions align within measurable tolerances. Platforms track these intersections through synchronized logs and dynamic thresholds, producing consistent data across different regulatory environments. Continued refinement of timing precision and correlation models supports more reliable automated processing in high-volume betting environments.