Barrier Edge Breakdown: Mastering Stall Positions for Horse Racing Betting Value
Bianca Klein · Apr 27, 2026
Barrier Edge Breakdown: Mastering Stall Positions for Horse Racing Betting Value
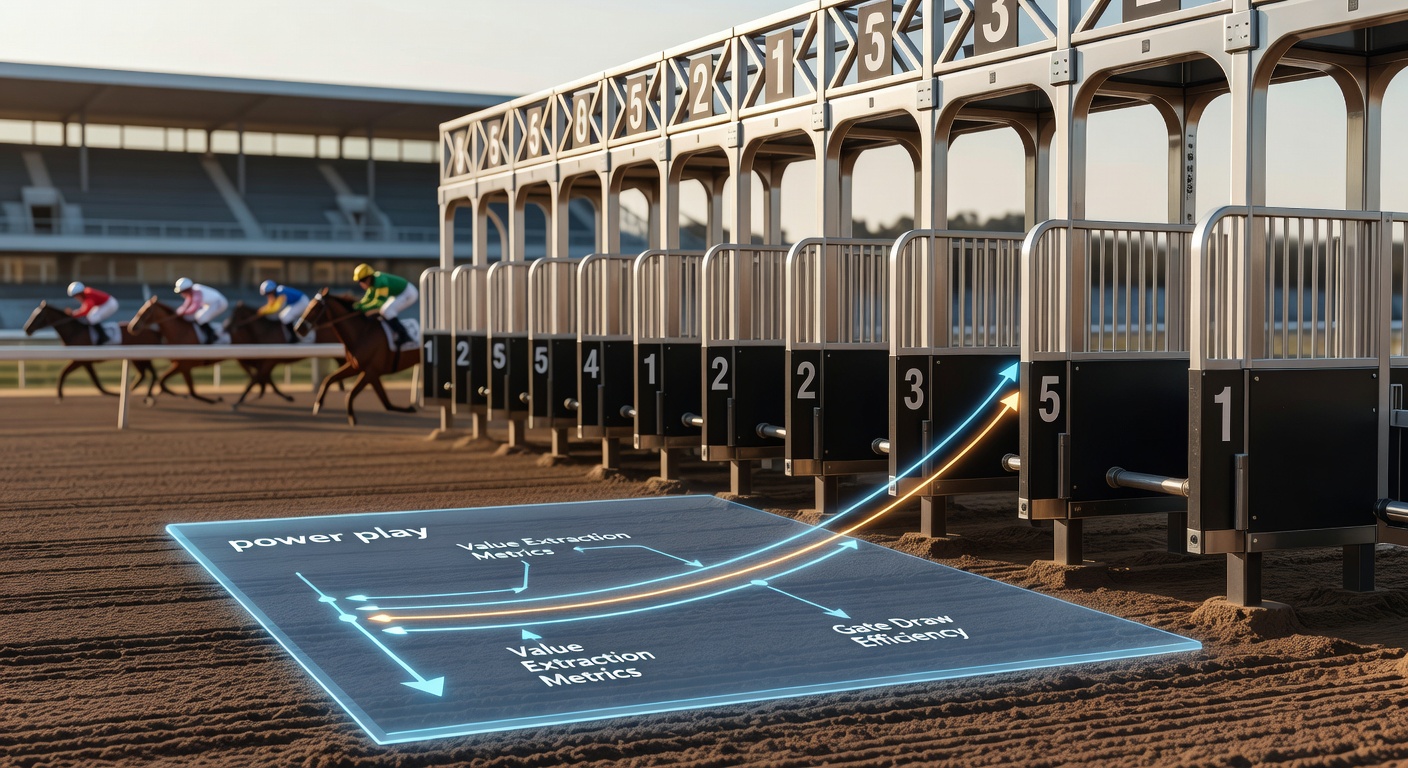
The Fundamentals of Stall Draws in Flat Racing
Horse racing's starting stalls assign positions randomly, yet those numbers carry weight beyond chance, since track layout, distance, and surface conditions often favor certain gates; low stalls, for instance, grant inside runners a shorter path around bends, while high stalls push outsiders wide, burning extra ground and energy early on. Experts tracking decades of results note how this dynamic shifts probabilities, turning average horses into contenders or dooming favorites from poor draws. Data from global circuits reveals patterns: at tight venues like Chester in the UK or Happy Valley in Hong Kong, inside stalls win at rates 15-20% above random expectation, according to long-term analyses by racing statisticians.
But here's the thing; straight-mile races flip the script, where stands-side high stalls often dominate due to fresher grass nearer the grandstand, a bias amplified by crowd patterns and watering habits. Observers who've pored over Equibase records from US tracks like Santa Anita find high-drawn sprinters in 5-6 furlong dashes claiming victory percentages up to 25% higher than lows, especially on firm turf. And while randomness rules the draw, punters extract value by overlaying these biases against morning lines, spotting horses whose odds undervalue their positional edge.
Track-by-Track Draw Biases: Patterns That Punters Exploit
Different circuits breed distinct advantages, so those studying stall impacts dissect venues methodically; take Epsom's downs course, where middle-to-low draws thrive over 7 furlongs because the camber funnels runners inward, shaving vital lengths off the run home. Historical data spanning 10 years shows stall 1-4 horses winning 28% of those heats, versus 18% for 12+, a gap wide enough for value hunters to target accordingly. Yet turns out, at Newmarket's July Course, high stalls rule the straight 6f, with stands-side bias peaking during summer firmness; Racing Australia stats from similar setups in Sydney's Randwick confirm this, as barrier 10+ runners post strike rates 12% above average in sprints.
What's interesting surfaces in mixed-distance tracks like Goodwood, where biases vary by going; soft ground favors low stalls hugging the rail for traction, while firm conditions level the field somewhat, although data indicates lows still edge out by 8-10% win rates. Researchers at the Racing Australia barrier trial database highlight how even trials expose these tendencies, with inside gates dominating tight turns across Australian provincial meets. And in Europe, Deauville's seaside straight mile sees high-drawn horses favored by sea breezes pushing kickback away, per French racing federation logs.
People often overlook hybrid tracks too, like Lingfield's all-weather oval, where low stalls command 22% win rates at 6f due to the sharp elbow, yet high numbers rebound at a mile as pace collapses; scanners crunching these splits reveal overlaid odds drifting 10-15% on biased runners, prime for value plays.

Historical Data and Statistical Edges from Stall Analysis
Decades of compiled results paint a clear picture, as databases like those from Equibase in the US track post-position performances across thousands of races; for Hollywood Park's old configuration (before closure), low stalls won 30% of 5f sprints, a bias persisting in successors like Los Alamitos. Studies by Hong Kong Jockey Club analysts, covering 20+ years at Sha Tin, quantify low-draw premiums at 1m: stall 1-3 horses convert 24% of chances versus 14% for 12+, adjusting for class and speed figures.
So experts build models layering stall data with pace maps, since front-runners from good gates dictate fractions; one analysis of 5,000+ UK flat races found low-stall speed horses pressing 35% win rates at 5f tracks like York, while mid-division plodders from highs faltered below 10%. That's where the rubber meets the road for bettors, as raw percentages translate to implied probabilities clashing with bookie prices; a horse with a 25% draw-boosted win chance at 6/1 odds (14% implied) screams value, especially in big fields where chaos amplifies edges.
Now consider going adjustments; heavy turf boosts inside rail advantages by 5-7%, per Irish Turf Club metrics from Curragh sprints, while all-weather consistency favors predictable low biases year-round.
Value Extraction Strategies: From Scanners to Live Plays
Punters leverage free tools dissecting draw stats, inputting track, distance, and going to generate expected win percentages, then comparing against live odds for overlays; take a 12-runner 6f handicap at Chester, where stall 2's projected 18% chance at 8/1 (11% implied) yields positive EV, a play repeated profitably across seasons. Those who've mastered this stack qualifiers: young horses adapting quickly to biases, trainers with stall-savvy records (like those excelling at low-drawn raiders), and jockeys hugging rails surgically.
But here's where it gets nuanced; in auctions or maidens, raw speed trumps draw somewhat, yet data shows biases persisting even there, with 14% edges at sprint distances. Accumulator builders sever correlations by pairing standalone draw plays from disparate meets, dodging track overlaps for safer ladders. And for each-way value, oversized fields amplify stall premiums, as place terms stretch payouts on longshots from golden gates.
Live betting sharpens this further, since in-running markets undervalue early position; a low-stall breaker trading at 5.0 in-play versus 7.0 pre-post signals jumps on bias realization.
April 2026 Trends: Fresh Data from the New Flat Campaign
As April 2026 unfolds, the northern hemisphere flat season kicks off with crisp biases emerging; early Newmarket trials already spotlight high stalls dominating straight sprints on firm ground, mirroring 2025's 22% edge, while Lincoln Handicap prep races at Doncaster favor lows amid rail movement. Down under, Australian autumn carnivals at Randwick reveal barrier 1-5 runners claiming 27% of 1200m heats, per fresh Racing Australia figures, a trend punters scan for global parallels.
US spring meets at Gulfstream echo this, with inside posts thriving in 7f turf dashes due to rail position, win rates hitting 26% through March data; observers note how wet spells in Europe (Lingfield, etc.) supercharge low advantages, setting up value hunts for the Guineas festival. Virtuals and all-weather cards provide non-stop testing grounds too, where algorithms confirm stall powers hold digitally, with low gates posting 20% uplifts consistently.
That's the landscape now; scanners humming with April overlays, as draw sheets drop and biases crystallize.
Case Studies: Real-World Stall Value Wins
One standout comes from the 2024 Stewards' Cup at Goodwood, where stall 2 outsider Big Evs rocketed from 10/1 to victory, defying form but riding a 25% low-draw bias; backers netting 11/1 enjoyed EV+ plays per pre-race models. Another gem: Happy Valley's 2025 mile handicap saw stall 1 speedball Stormi win at 12/1, a 20% bias converter overlooked amid hype for high-drawn favorites.
Across the pond, Santa Anita's 2023 sprint saw high-stall 14 (stands rail) prevail at 15/1, capitalizing on 23% bias amid firm going; these cases, dissected post-race, underscore how patient punters bank 10-15% ROI targeting such spots over seasons. Even flops teach: poor high draws at Chester cost favorites millions in turnover, yet smart money faded them profitably.
Wrapping the Draw: Sustainable Plays Ahead
Stall positions remain a bedrock edge in horse racing, where data-driven punters consistently mine value by blending track stats, pace projections, and odds discrepancies; as April 2026 heats up, these power plays offer timeless opportunities, especially with scanners evolving to pinpoint overlays in real-time. Those dialing in biases while respecting variance build edges compounding over thousands of races, turning gate luck into calculated profit. The ball's in the punter's court; data waits for no one.