Bankroll Mapping Techniques Using Calculators in Matched and Arbitrage Betting Environments
Leon Keller · Aug 1, 2026
Bankroll Mapping Techniques Using Calculators in Matched and Arbitrage Betting Environments
Bankroll trajectories in matched and arbitrage betting follow predictable patterns when participants apply dedicated calculators to project outcomes across multiple cycles, and these tools integrate variables such as stake sizes, bonus structures, and odds differentials to generate forward-looking simulations. Observers note that matched betting relies on pairing bets at different bookmakers to lock in profits from promotional offers while arbitrage exploits price discrepancies between markets to secure risk-free returns, and calculators map how these activities alter available funds over time.
Core Mechanics of Matched Betting Bankroll Paths
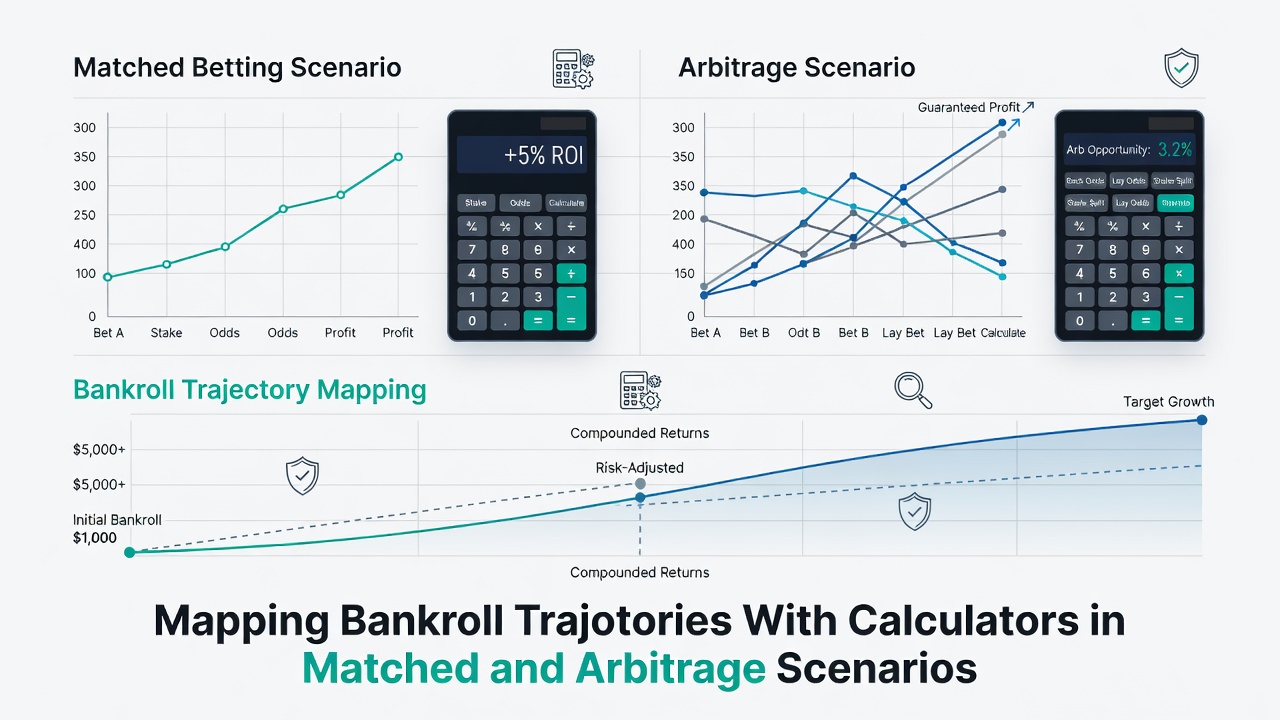
Matched betting scenarios involve placing a back bet at one operator against a lay bet at another exchange, which neutralizes outcome risk and converts bonus funds into withdrawable cash, and calculators account for commission rates, qualifying losses, and reload frequencies to chart incremental bankroll growth. Data from industry reports shows that repeated cycles produce linear upward trajectories when users reinvest only a portion of extracted profits, whereas full reinvestment accelerates the curve until external limits like account restrictions intervene. Those who study these patterns find that calculators often incorporate time-based decay factors for expiring offers, allowing projections that align with seasonal promotional calendars.
Arbitrage Dynamics and Trajectory Shifts
Arbitrage positions emerge when odds across multiple platforms create a guaranteed margin regardless of event results, and specialized calculators adjust for liquidity constraints, bet acceptance delays, and currency conversions to forecast bankroll expansion under varying market conditions. Research indicates that high-frequency arbitrage in liquid sports markets generates steady compounding effects, yet calculators reveal plateaus when available edges shrink below operational thresholds. Experts have observed that combining arbitrage with matched elements creates hybrid trajectories where initial bonus exploitation funds larger stakes in discrepancy plays, and these models highlight inflection points where bankroll size unlocks access to higher-limit markets.
Calculator Features for Trajectory Visualization
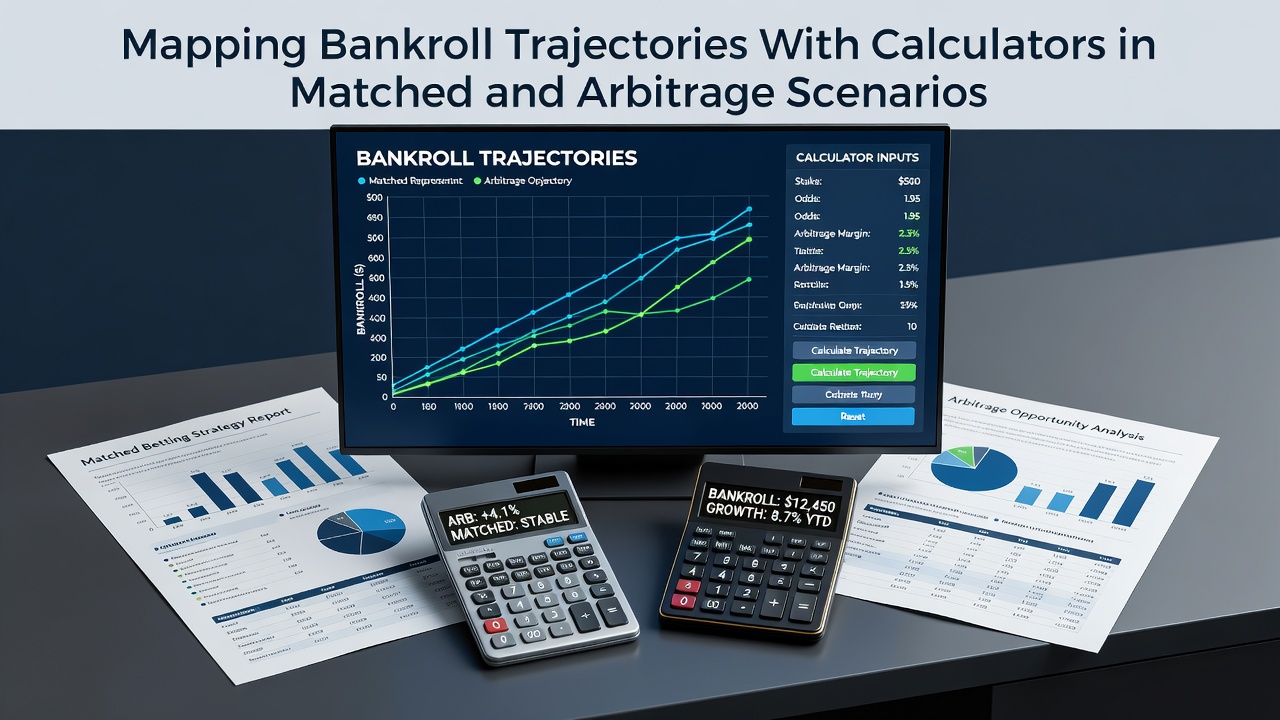
Modern calculators input current bankroll, expected edge percentages, cycle frequency, and withdrawal habits to output graphs that display projected balances at weekly or monthly intervals, and they often include sensitivity analysis sliders for testing different risk parameters. Users adjust variables such as average bonus value or arbitrage margin to observe how small changes compound into significant divergences over extended periods, and this functionality helps map realistic versus optimistic scenarios based on historical performance data. What's interesting is that some platforms now integrate live odds feeds to update projections dynamically, turning static forecasts into adaptive tools that reflect real-time market shifts.
Take one researcher who examined European betting patterns and found that calculators incorporating tax implications and payment processing fees produce more accurate long-term bankroll curves than simplified models, and similar studies from Australian research institutions confirm the value of these adjustments in cross-border operations. Those who've tracked outcomes note that visual outputs help identify periods of accelerated drawdown risk during offer droughts, prompting users to scale activity accordingly.
Integration With Broader Betting Ecosystems
Calculators designed for these scenarios frequently interface with odds comparison databases and exchange APIs, which allows seamless import of live data to refine trajectory estimates without manual entry, and this connectivity supports multi-account management across jurisdictions. As of August 2026, platforms report increased demand for such integrated tools amid expanding regulatory frameworks in North America and the EU, where operators face stricter bonus transparency rules that affect matched betting viability. Figures from the International Association of Gaming Regulators reveal regional variations in how these restrictions alter profit extraction rates, and calculators adapted for compliance tracking help users navigate those differences.
One study revealed that participants who combine calculator projections with disciplined staking plans achieve more consistent bankroll growth compared to ad-hoc approaches, while another analysis from Canadian gaming research groups highlighted the role of variance buffers in preventing trajectory disruptions during losing streaks that occasionally affect even low-risk strategies. Observers note that educational resources on these tools emphasize starting with conservative assumptions to build reliable baseline maps before layering in advanced variables.
Conclusion
Mapping bankroll trajectories through calculators provides structured insights into matched and arbitrage betting outcomes by quantifying how repeated cycles interact with market conditions and operational constraints, and continued development of these tools supports more precise planning across diverse regulatory environments. Data shows that accurate projections depend on comprehensive input parameters and regular updates to reflect evolving bookmaker policies and odds landscapes.